
Now Reading: Australia v England 2nd ODI Preview: Why the Numbers Lean Towards the Hosts at Adelaide Oval
-
01
Australia v England 2nd ODI Preview: Why the Numbers Lean Towards the Hosts at Adelaide Oval

Australia v England 2nd ODI Preview: Why the Numbers Lean Towards the Hosts at Adelaide Oval

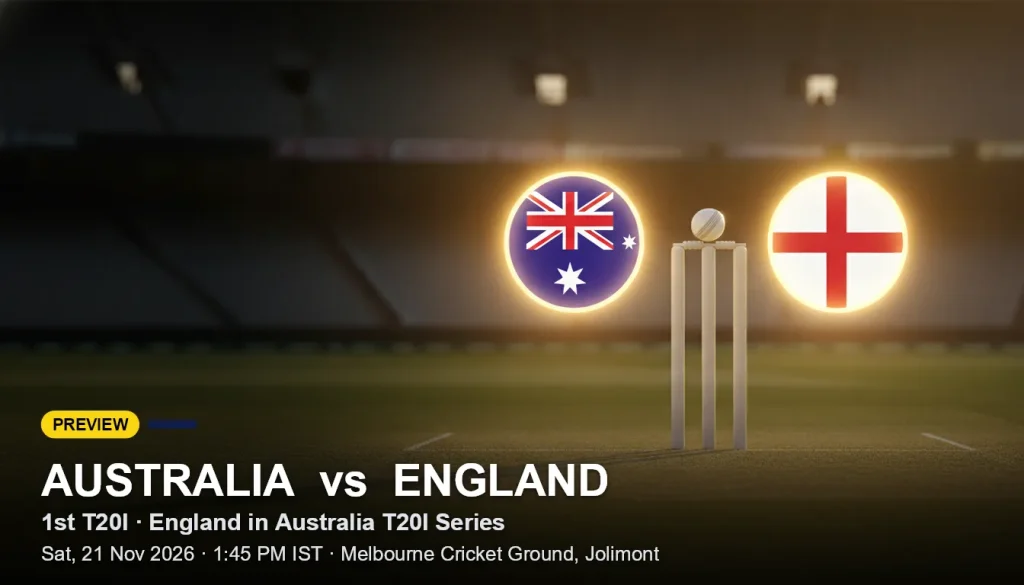
Adelaide Oval stages the second ODI of England’s tour of Australia on Sunday, 15 November 2026, and the numbers point one way. CricStats’ data lean favours the hosts, but England’s batters have been piling up runs. Here is what the form, history and venue data suggest.
Head-to-Head: Australia Hold a Big Edge
Australia and England first met in ODIs in 1971. Across 161 matches, Australia have won 91 and England 65, with 5 ending as ties, draws or no results.
The recent picture is closer than the all-time record suggests. The last five meetings were split 3-2 in Australia’s favour, with England winning twice by big margins in September 2024.
| Date | Result | Venue |
|---|---|---|
| 22 Feb 2025 | Australia won by 5 wickets (15 balls remaining) | Gaddafi Stadium |
| 29 Sep 2024 | Australia won by 49 runs (DLS method) | County Ground |
| 27 Sep 2024 | England won by 186 runs | Lord’s |
| 24 Sep 2024 | England won by 46 runs (DLS method) | Riverside Ground |
| 21 Sep 2024 | Australia won by 68 runs | Headingley |
Across the last 10 decisive meetings, CricStats puts Australia at 80% and England at 20%. The two sides have met nine times at this venue.
Recent Form: Australia Ahead, England Inconsistent
Australia have won 7 of their last 10 completed ODIs (W L L W W W L W W W, newest first). England have won 5 of 10 (W L L L W L W W W L).
Australia’s latest run included a one-wicket win over Zimbabwe with one ball to spare. They also lost twice to South Africa before taking the third game by 45 runs (DLS method).
England’s last five were a mix of extremes. They beat Sri Lanka by 223 runs on 27 September, then lost to Sri Lanka by 2 wickets off the final ball. Pakistan beat them twice, by 87 runs and then by 1 wicket, before England won by 55 runs against Sri Lanka on 29 October.
| Team | Last 10 ODIs | Win rate |
|---|---|---|
| Australia | 7 won, 3 lost | 70% |
| England | 5 won, 5 lost | 50% |
Adelaide Oval: A Balanced Venue
Adelaide Oval has hosted 88 completed ODIs. Teams batting first have won 46 and those chasing have won 40, so neither approach has a decisive edge.
The average first-innings total is 230. That suggests a par score that rewards solid batting without demanding a mammoth total.
Players Who Have Been in Form
Squads for this match are not confirmed, so these are players who have performed well over the last 12 months, not certain starters.
Australia
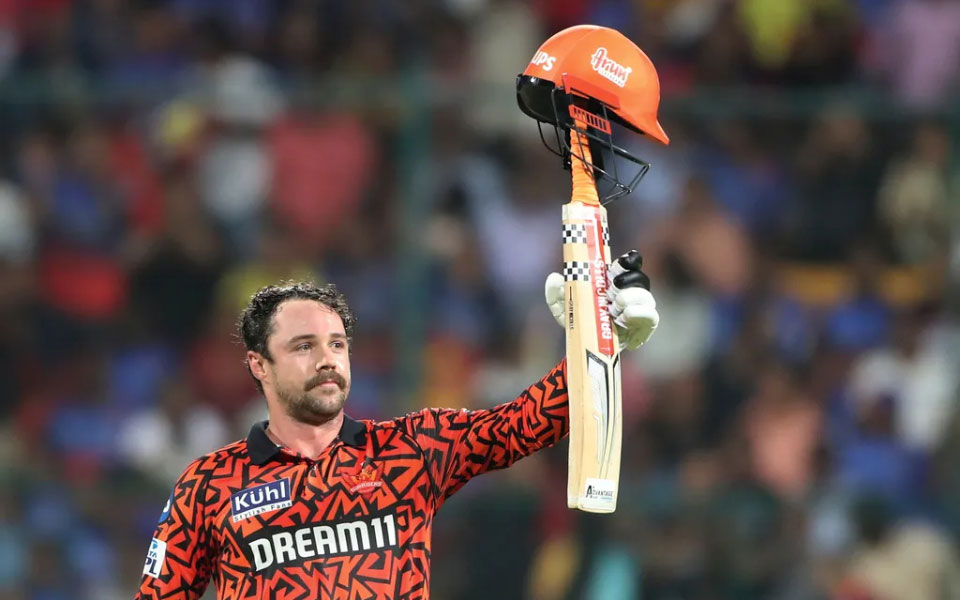
Mitchell Marsh has scored 297 runs in 6 innings, with a best of 84. Travis Head has 266 in 6 with a best of 112, and Matt Renshaw has 234 in 6 with a best of 109. With the ball, Nathan Ellis has 12 wickets in 5 matches and Adam Zampa has 9 in 6.
England
England’s batting numbers come from far bigger samples. Ben Duckett has 746 runs in 14 innings (best 167), Joe Root 697 in 13 (best 111) and Harry Brook 613 in 14 (best 202). Liam Dawson leads the bowlers with 14 wickets in 8 matches, followed by Sam Curran and Will Jacks with 12 each.
| Side | Batter | Runs | Innings | Best |
|---|---|---|---|---|
| Australia | Mitchell Marsh | 297 | 6 | 84 |
| Australia | Travis Head | 266 | 6 | 112 |
| Australia | Matt Renshaw | 234 | 6 | 109 |
| England | Ben Duckett | 746 | 14 | 167 |
| England | Joe Root | 697 | 13 | 111 |
| England | Harry Brook | 613 | 14 | 202 |
Fixture History Since 2021
In this fixture since 2021, Travis Head leads the runs with 494 in 8 innings. Ben Duckett is next with 479 in 7, and Steven Smith has 337 in 9. Among the wicket-takers, Adam Zampa has 21, Mitchell Starc 10 and Brydon Carse 9.
Zampa’s 21 wickets stand out, more than double any other bowler in the fixture over that period.
CricStats Prediction
The data lean is clear. Australia come out at 70% and England at 30%, based on the head-to-head record, recent win rates and the 80-20 split in the last 10 decisive meetings.
This is what the numbers suggest, not a certainty. England’s top-order run totals are impressive, and Adelaide’s near-even split between batting first and chasing leaves room for an upset. On paper, though, the hosts hold the edge going into Sunday.