
Now Reading: New Zealand vs India 2nd ODI Preview: Can the Hosts Hit Back?
-
01
New Zealand vs India 2nd ODI Preview: Can the Hosts Hit Back?


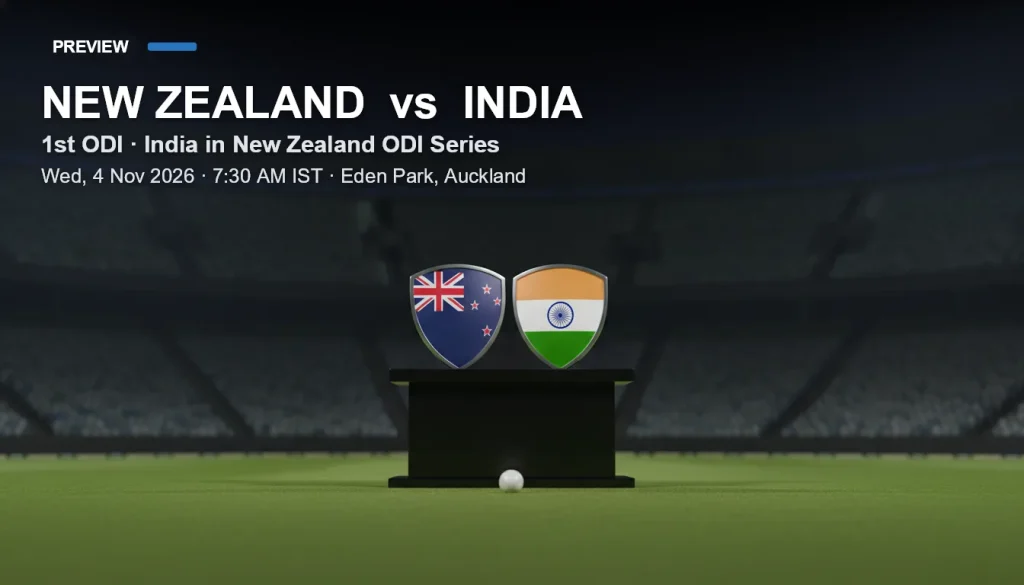
New Zealand and India meet again on Saturday, 7 November 2026, and the pressure is on. India won the most recent clash by five wickets under DLS, so the hosts need a response. Here is what the CricStats numbers say before the 2nd ODI.
Head-to-Head: India Hold the Historical Edge
This rivalry stretches back to 1975, and India lead the all-time ODI ledger. Across 124 meetings, India have won 64 and New Zealand 52, with 8 ending as ties, draws or no results.
| All-Time ODI Record | Matches |
|---|---|
| Played | 124 |
| India won | 64 |
| New Zealand won | 52 |
| Tied / drawn / no result | 8 |
The recent picture is closer than the long-term numbers suggest. The last five meetings have swung back and forth.
| Date | Result | Venue |
|---|---|---|
| 4 Nov 2026 | India won by 5 wickets (DLS, 56 balls remaining) | Eden Park |
| 18 Jan 2026 | New Zealand won by 41 runs | Holkar Cricket Stadium |
| 14 Jan 2026 | New Zealand won by 7 wickets (15 balls remaining) | Saurashtra Cricket Association Stadium |
| 11 Jan 2026 | India won by 4 wickets (6 balls remaining) | Kotambi Stadium, Vadodara |
| 9 Mar 2025 | India won by 4 wickets (6 balls remaining) | Dubai International Cricket Stadium |
New Zealand have shown they can win this fixture, taking two in a row in January 2026. Still, across the last 10 decisive meetings, the split is New Zealand 20% and India 80%.
Recent Form: Momentum Meets Inconsistency
New Zealand have won 6 of their last 10 completed ODIs, a 60% win rate. Their run reads L L W W W L W W L W, newest first. That includes a West Indies series in July where they won three of four, and the last of those games went to the visitors by two wickets.
India have won 5 of their last 10, a 50% win rate, with a form line of W L W W L L W L L W. Their September and October games against West Indies brought two eight-wicket wins and then a five-wicket defeat. A 27-run loss to England came in July.
| Team | Last 10 (newest first) | Won | Lost | Win rate |
|---|---|---|---|---|
| New Zealand | L L W W W L W W L W | 6 | 4 | 60% |
| India | W L W W L L W L L W | 5 | 5 | 50% |
Players Who Have Been in Form
Squads for this match are not confirmed, so these are players who have produced over the last 12 months, not certain starters. The numbers still show where the threats have come from.
New Zealand: Mitchell Leads the Batting Charge
Daryl Mitchell has 620 runs in 8 innings with a best of 137. Will Young has 328 runs in 12 innings, and Tom Latham has 237 in 9. With the ball, Jayden Lennox has 17 wickets in 7 matches, Kyle Jamieson 14 in 7 and Mitchell Santner 10 in 8.
India: Kohli, Gill and Rohit Set the Pace
Virat Kohli has 928 runs in 13 innings with a best of 139. Shubman Gill has 694 in 10 innings, including a best of 223. Rohit Sharma has 607 in 13 with a best of 138. In the bowling department, Kuldeep Yadav has 19 wickets in 9 matches, Prasidh Krishna 18 in 10 and Arshdeep Singh 12 in 6.
| Team | Player | Last 12 Months | Best |
|---|---|---|---|
| New Zealand | Daryl Mitchell | 620 runs, 8 inns | 137 |
| New Zealand | Will Young | 328 runs, 12 inns | 87 |
| New Zealand | Tom Latham | 237 runs, 9 inns | 69 |
| India | Virat Kohli | 928 runs, 13 inns | 139 |
| India | Shubman Gill | 694 runs, 10 inns | 223 |
| India | Rohit Sharma | 607 runs, 13 inns | 138 |
| Team | Bowler | Last 12 Months |
|---|---|---|
| New Zealand | Jayden Lennox | 17 wkts, 7 matches |
| New Zealand | Kyle Jamieson | 14 wkts, 7 matches |
| New Zealand | Mitchell Santner | 10 wkts, 8 matches |
| India | Kuldeep Yadav | 19 wkts, 9 matches |
| India | Prasidh Krishna | 18 wkts, 10 matches |
| India | Arshdeep Singh | 12 wkts, 6 matches |
Top Performers in This Fixture Since 2021
The head-to-head leaderboard since 2021 tells a striking story. Gill leads the runs chart with 779 in 14 innings, with Mitchell close behind on 769 in 12. Kohli sits third with 593 in 11.
India dominate the wickets column. Mohammed Shami has 17, Kuldeep Yadav 16 and Mohammed Siraj 10.
| Category | Player | Total |
|---|---|---|
| Runs | Shubman Gill (India) | 779 in 14 inns |
| Runs | Daryl Mitchell (New Zealand) | 769 in 12 inns |
| Runs | Virat Kohli (India) | 593 in 11 inns |
| Wickets | Mohammed Shami (India) | 17 |
| Wickets | Kuldeep Yadav (India) | 16 |
| Wickets | Mohammed Siraj (India) | 10 |
CricStats Prediction: The Numbers Lean India
The CricStats data lean is computed, not a hunch. It combines the head-to-head record and recent form, and it puts India as slight favourites at 62% against 38% for New Zealand.
The numbers suggest an edge, not a certainty. New Zealand’s 60% recent win rate, Mitchell’s consistency and a pair of January wins over India show the hosts can flip this fixture. The lean comes from India’s 80% share of the last 10 decisive meetings.
| CricStats Data Lean | Probability |
|---|---|
| New Zealand | 38% |
| India | 62% |
Can New Zealand level the series and silence the numbers, or will India stretch their grip? The 2nd ODI should have plenty to say about that.