
Now Reading: South Africa v Australia 3rd Test Preview: Newlands Clash Too Close to Call
-
01
South Africa v Australia 3rd Test Preview: Newlands Clash Too Close to Call


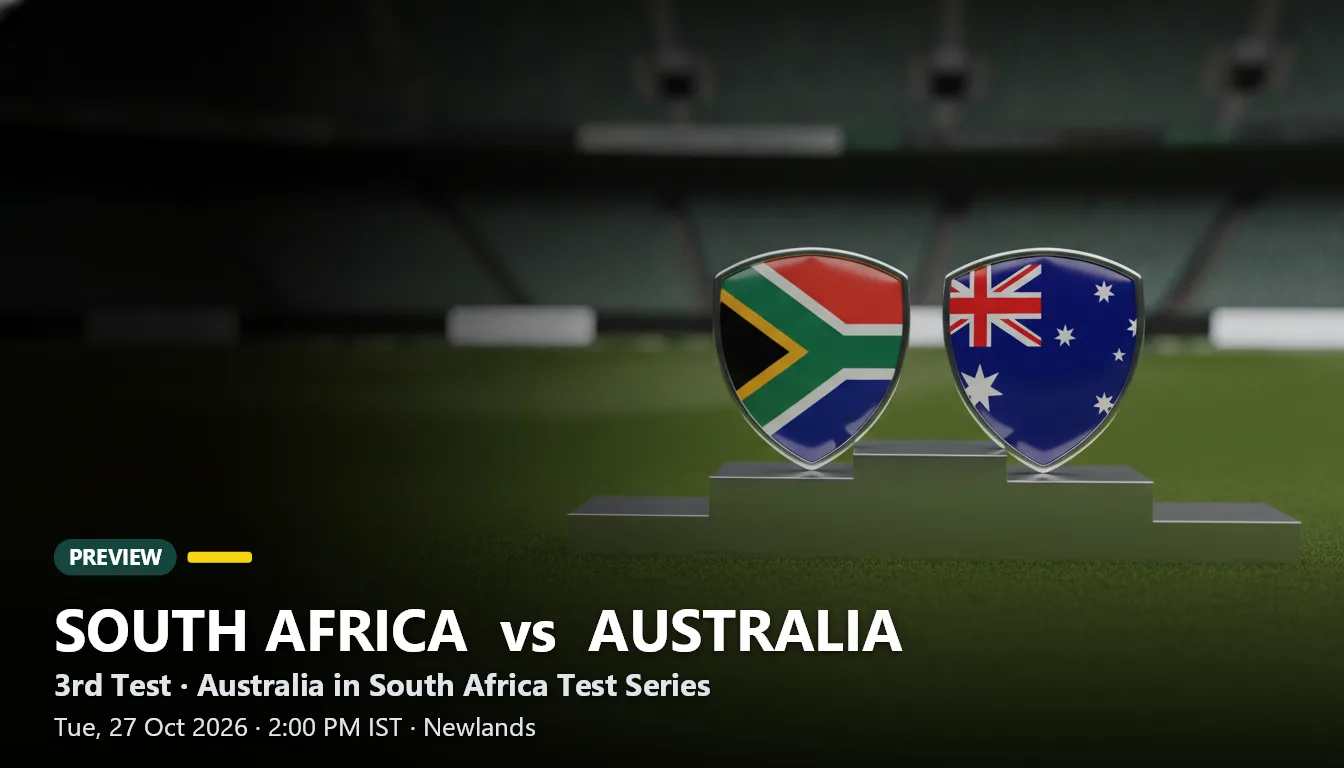
Newlands is set to host a third Test that the numbers say could go either way. South Africa and Australia have each won one of their last two meetings, and the CricStats data lean is razor-thin. Here is the form, the history and the players to watch.
Rivalry Snapshot: Australia Lead the History, But Recent Meetings Are Level
Across 103 Tests dating back to 1902, Australia hold a clear all-time edge. But the most recent chapter has swung both ways in dramatic fashion.
| All-Time Test Record | Matches |
|---|---|
| Played | 103 |
| South Africa won | 27 |
| Australia won | 55 |
| Tied, drawn or no result | 21 |
| Meetings at Newlands | 14 |
In the last 10 decisive meetings, the split is an even 50% each. That tells you how closely matched these sides have been lately.
Recent Meetings: Momentum Has Flipped
| Date | Venue | Result |
|---|---|---|
| 18 Oct 2026 | St George’s Park | South Africa won by an innings and 31 runs |
| 9 Oct 2026 | Kingsmead | Australia won by 214 runs |
| 4 Jan 2023 | Sydney Cricket Ground | Match drawn |
| 26 Dec 2022 | Melbourne Cricket Ground | Australia won by an innings and 182 runs |
| 17 Dec 2022 | Brisbane Cricket Ground | Australia won by 6 wickets |
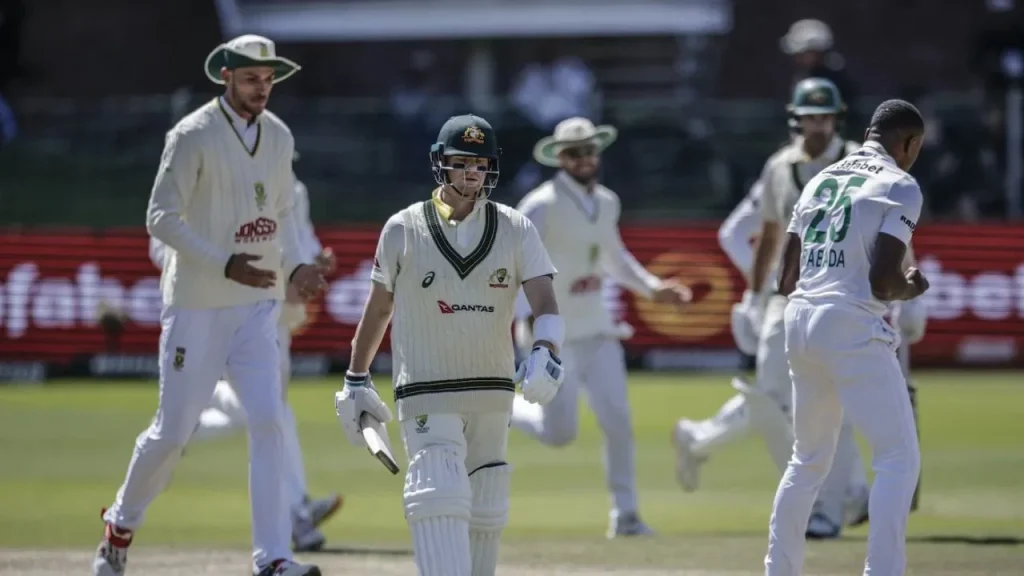
Australia took the first of the two Tests by 214 runs at Kingsmead. South Africa answered with an innings-and-31-run win at St George’s Park. The third Test now arrives with plenty of momentum on the line.
Form Guide: Both Sides Arrive Winning
Neither team is short of confidence. Over their last 10 completed Tests against any opposition, South Africa have won 8 and lost 2. Australia have won 7 and lost 3.
| Team | Last 10 (newest first) | Won | Lost | Win rate |
|---|---|---|---|---|
| South Africa | W L W W W L W W W W | 8 | 2 | 80% |
| Australia | L W W L W L W W W W | 7 | 3 | 70% |
South Africa’s recent run includes a 408-run win over India and a 30-run win over India in November 2025. Australia’s includes an innings-and-51-run win over Bangladesh in August 2026, though Bangladesh did win by 9 wickets in the Test before it.
The Newlands Factor
Newlands has staged 60 completed Tests. Sides batting first have won 14 of them, while sides chasing have won 23. The average first-innings total at the ground is 317.
Those figures suggest the chase has historically been the stronger route here. That is a venue trend from the database, not a pitch report, and it should be read as context only.
Players Who Have Been in Form
Squads for this match are not confirmed, so these are players who have performed well over the last 12 months, not certain starters.
South Africa
Temba Bavuma has 285 runs in 7 innings with a best of 179. Marco Jansen has 252 runs in 6 innings and also leads the bowling with 22 wickets in 4 matches. Simon Harmer has taken 21 wickets in 4 matches, and Aiden Markram has 225 runs in 7 innings.
Australia
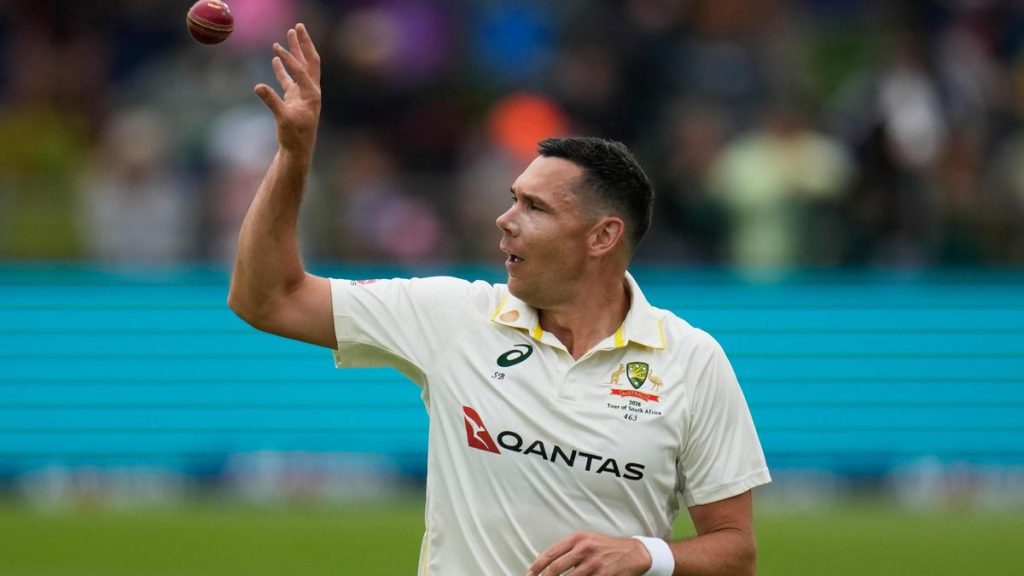
Travis Head has piled up 845 runs in 17 innings, with a best of 170. Steven Smith has 526 runs in 15 innings, and Alex Carey has 452 in 15. With the ball, Mitchell Starc has 49 wickets in 9 matches, Scott Boland has 25 in 6, and Pat Cummins has 17 in 5.
| Player | Team | Last 12 months |
|---|---|---|
| Travis Head | Australia | 845 runs in 17 inns |
| Steven Smith | Australia | 526 runs in 15 inns |
| Temba Bavuma | South Africa | 285 runs in 7 inns |
| Mitchell Starc | Australia | 49 wkts in 9 matches |
| Marco Jansen | South Africa | 22 wkts in 4 matches |
| Simon Harmer | South Africa | 21 wkts in 4 matches |
Head-to-Head Heroes Since 2021
In this fixture since 2021, Temba Bavuma and Travis Head are level at the top of the run charts with 368 each. Bavuma got there in 9 innings and Head in 8. Steven Smith sits third on 314 runs in 8 innings.
With the ball, Kagiso Rabada leads with 17 wickets, ahead of Pat Cummins with 16 and Mitchell Starc with 14.
CricStats Prediction: Too Close to Call
The CricStats data lean is computed from the numbers, not guessed. Over the last 10 decisive meetings, South Africa and Australia are level at 50% each. South Africa’s recent win rate is 80% against Australia’s 70%.
Put together, the numbers give South Africa a slight edge of 53% to 47%. That is firmly in too-close-to-call territory, and it reflects what the numbers suggest rather than a certainty.
With the series level at one Test apiece on recent results and both sides in strong form, Newlands looks set for a gripping contest.